Technical Details
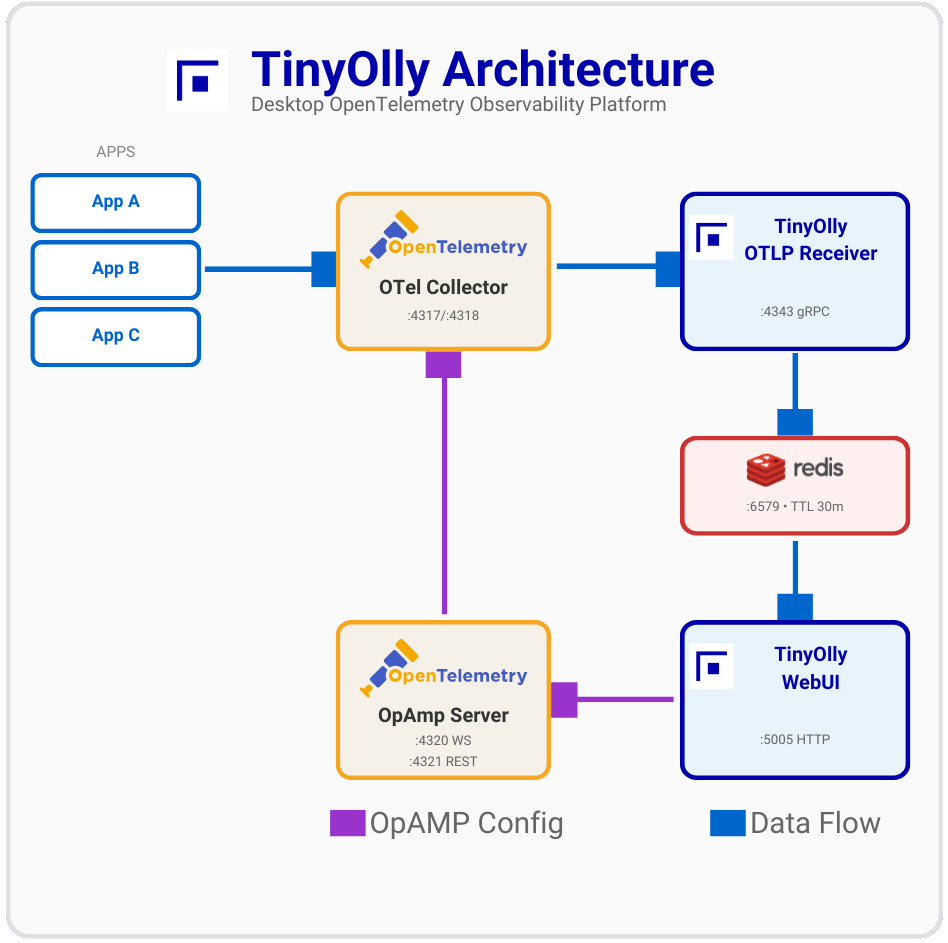
Architecture
Data Storage
- Format: Full OpenTelemetry (OTEL) format for traces, logs, and metrics
- SQLite: All telemetry stored in an embedded SQLite database (compressed with ZSTD + msgpack)
- WAL Mode: Write-Ahead Logging for concurrent reads during writes
- Space-Based Retention: Data is retained until the database reaches its size limit (default 256 MB), then oldest records are evicted automatically. No fixed TTL — data stays as long as there's room
- Correlation: Native trace-metric-log correlation via trace/span IDs
- Cardinality Protection: Prevents metric explosion
- Ephemeral by Design: Designed for local development — data persists across restarts but is evicted when storage fills up
OTLP Compatibility
TinyOlly is fully OpenTelemetry-native:
- Ingestion: Accepts OTLP/gRPC (primary) and OTLP/HTTP
- Storage: Stores traces, logs, and metrics in full OTEL format with resources, scopes, and attributes
- Correlation: Native support for trace/span ID correlation across all telemetry types
- REST API: Exposes OTEL-formatted JSON for programmatic access
- Control Plane: OpenTelemetry Collector OpAmp for dynamic configuration
UI Features
- Trace Waterfall: Distributed trace visualization with automatic filtering of noisy ASGI sub-spans (http send/receive)
- Trace Map: Per-trace service dependency graph rendered above the waterfall using Cytoscape.js. Detects inferred external clients from orphan parent span IDs (e.g., test clients that propagate trace context but don't export spans)
- Deep Linking: Shareable URLs that open directly to a specific trace detail view (
?tab=traces&traceId=...), span search (?tab=spans&spanId=...), or filtered tab (?tab=logs&search=...). "Copy Link" buttons in trace and span detail views generate these URLs - Click-to-Copy IDs: Trace and span IDs are copyable with a single click throughout the UI
- Correlated Logs: Trace detail view shows correlated logs inline — click any log row to navigate to the Logs tab filtered by trace ID
- Cross-Tab Navigation: Click trace/span IDs in logs to jump to the corresponding trace or span view
- Service Catalog: RED metrics with action buttons to navigate to Traces, Spans, Logs, or Metrics filtered by service name
- Smart Auto-Refresh: 5-second polling pauses automatically when a search filter is active, preventing result disruption
- Scrollable Lists: Trace, span, and log lists support scrolling with sticky headers for large datasets